Cricket Inning Comparison Made Simple
Ever watched a match and wondered why one inning felt stronger than another? It’s not just the total runs – a handful of numbers can tell the whole story. Below, we break down the most useful stats and how to put them side by side so you can instantly see which side dominated.
Key Factors to Compare
Run rate. Divide the total runs by overs faced. A higher run rate means the team scored faster, putting pressure on the opposition. For example, 250 runs off 40 overs gives a run rate of 6.25, while the same 250 off 45 overs drops to 5.55.
Wicket momentum. Look at when wickets fell. An inning that loses five wickets in the first 10 overs is fragile, even if it ends with a big total. Plotting wickets on a timeline helps you spot collapses or recovery phases.
Boundary count. Boundaries (fours and sixes) show aggression. Compare the number of fours and sixes each side hit – more boundaries usually mean a higher strike rate and tougher bowlers.
Partnership highlights. Strong partnerships calm the chase or build a big total. Note the longest partnership and its run rate. A 100‑run stand at 7 runs per over is more valuable than a quick 30‑run blast.
Extras. Extras (no‑balls, wides, byes) can swing the balance. A side that concedes many wides gives the batting team free runs, which often shows up in close matches.
Simple Tools to Use
All the data you need is on the scoreboard. Copy the numbers into a spreadsheet and create a quick table with columns for runs, overs, run rate, wickets, boundaries, and extras. Use basic formulas – run rate = runs ÷ overs, strike rate = (runs ÷ balls) × 100 – to get instant comparisons.
If you prefer visual aid, draw a simple line chart: one line for runs scored over overs, another for wickets fallen. The crossing points reveal pressure moments. Many free online tools let you paste the data and generate these charts in seconds.
For deeper insight, check the average strike rate of the top five batsmen in each inning. Higher strike rates from set‑players often signal a dominant inning, while low strike rates may indicate a defensive approach.
Finally, remember context. A low‑scoring inning on a difficult pitch can be more impressive than a high score on a batting paradise. Compare the conditions, pitch reports, and match situation to get the full picture.
By focusing on run rate, wicket timing, boundaries, partnerships, and extras, and using a quick spreadsheet or chart, you’ll be able to compare innings like a pro. Next time you watch a game, pull out your phone, note these stats, and see which side really had the edge. Happy analysing!
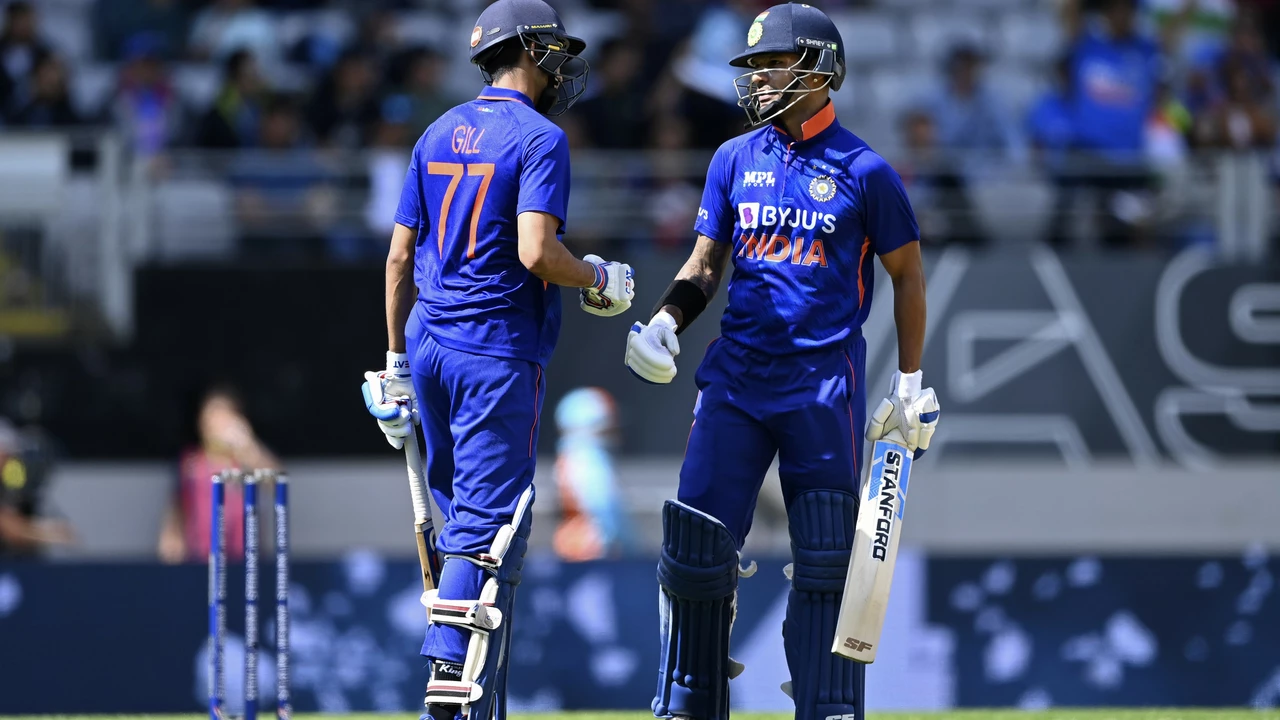
Who played a better inning, Shubman Gill or Rishabh Pant?
After watching both Shubman Gill and Rishabh Pant knock it out of the park, it's a real pickle to pick who played the better innings. But hey, it's a good problem to have, right? Gill's technique and timing were as sweet as a freshly baked apple pie, while Pant's audacity and aggression were as spicy as a jalapeno. Both young guns really set the pitch on fire! But if I had to choose, I'd say Pant's inning had that extra sprinkle of daring that made it slightly more entertaining.
